Michigan Technological University is a flagship public research university founded in 1885. Our campus in Michigan's Upper Peninsula overlooks the Keweenaw Waterway and is just a few miles from Lake Superior.
Michigan Technological University

Degrees for What Tomorrow Needs
Find what makes you tick. Work hard. Change the world. With more than 125 degree programs to choose from, you’ll be sure to find an academic home at Michigan Tech that suits your unique passions and strengths.
Browse by Degree Level:


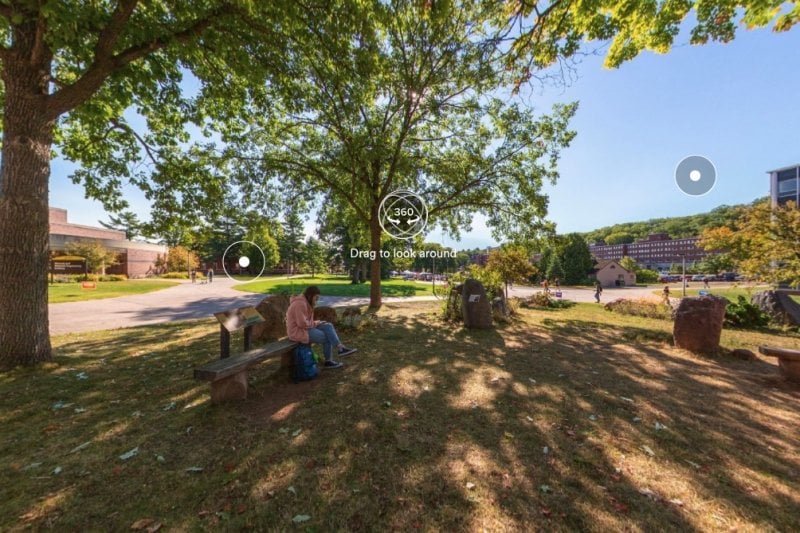

Come Home to Houghton
Our beautiful waterfront campus in Michigan's Upper Peninsula is situated just miles from Lake Superior. Find yourself in a close-knit college town where winters are epic and outdoor adventure awaits. At Tech, we embrace our size, climate, sense of adventure, and originality.
Visit us in Houghton and find where you belong.

Michigan Technological University is located in Houghton, Michigan.

Our campus in Houghton is the perfect blend of technology and natural beauty.
.")
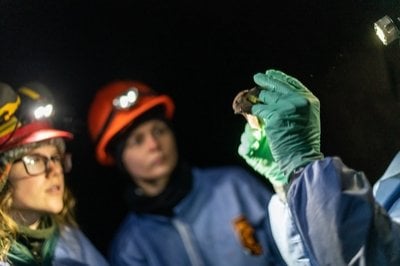
At Michigan Tech, outdoor adventure comes with the territory (in any season).

Huskies ski and snowboard for free at Mont Ripley, our very own hill that overlooks campus.

Houghton, its sister city Hancock, and the surrounding towns is home to approximately 15,000 year-round residents.

Lake Superior is all around you here in the Keweenaw Peninsula.

With more than 200 inches of annual snowfall, Houghton is one of the snowiest cities in the US.

Schedule a campus tour and experience Michigan Tech for yourself.
Spring Commencement
Congratulations to all of our graduates! Michigan Tech holds two Spring Commencement ceremonies, one for undergraduates and one for graduate students. The graduate student ceremony will take place Friday, April 26 at 3 p.m and the undergraduate student ceremony will take place Saturday, April 27 at 10:30 a.m. Both ceremonies will be held in the MacInnes Student Ice Arena.


Summer Youth Programs
Summer Youth Programs (SYP) is a fantastic, camp-like, mini-college experience that packs a ton of hands-on learning, experimenting, and fun into each day. Every summer, nearly 1,000 students from around the world in grades six to 11 come to campus for week-long explorations in science and technology, engineering, computing, business, and humanities. Join us this summer to spark curiosity, explore interests, and forge lasting friendships.

East Hall Construction
At Michigan's flagship technological university, we're preparing for tomorrow.
The East Hall, a new 516-student residence, accommodates Tech's growing student body with easy access to campus and the Keweenaw Waterway. The project is planned to be completed and the building occupied by Fall 2025.
Latest News and Stories
Featured Events
Stay Connected
Subscribe here and we'll email you the latest Michigan Tech News and featured campus events each month.
Tomorrow needs Michigan Tech.
Tomorrow needs you.
Take the next step and join Husky nation.